It’s time to take a look at Corcoran’s Quarterly Reports for Manhattan and Brooklyn for Q1 2020.
This quarter, due to the HUGE amount of uncertainty surrounding the real estate market, we’re going to skip the “rent vs buy” feature. But once we have a clearer idea of how COVID-19 is making its impact, it’ll be back.
Now, let’s get back to the market reports…
If you want to check out the full reports, you can click here for Manhattan and click here for Brooklyn. Check out the infographic summaries below.
Just before the pandemic hit, there were some positive signs for the sales market in both Manhattan and Brooklyn.
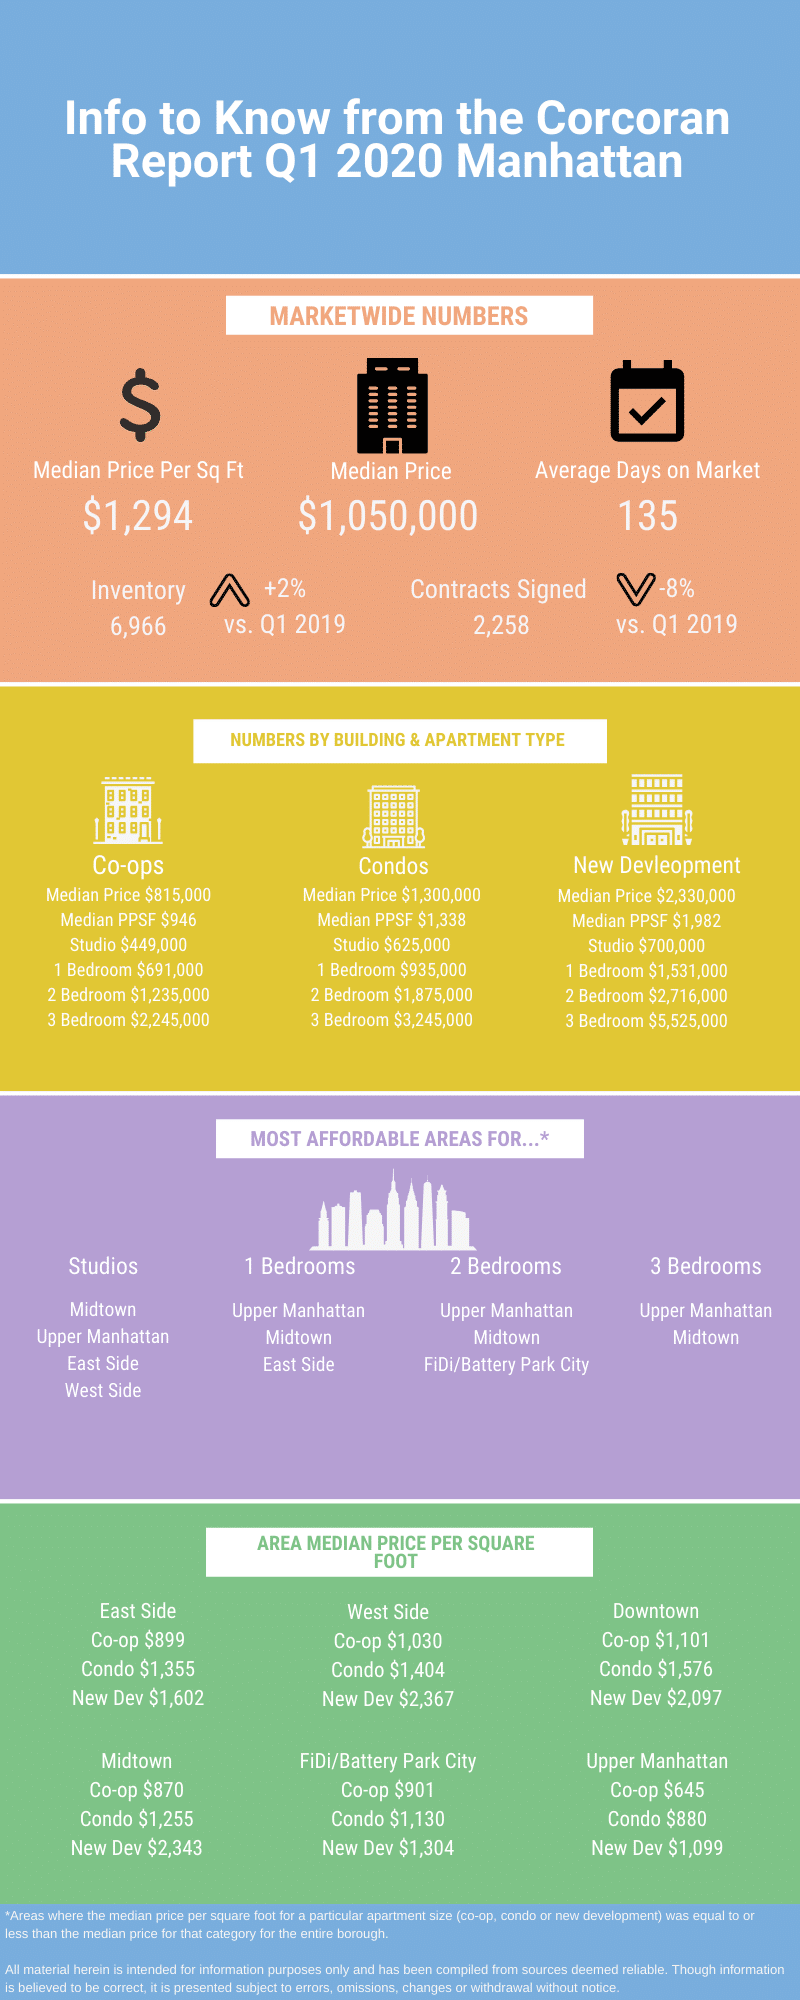
The overall median sales price for Manhattan was $1.050 million – still down year over year but actually up 5% versus the previous quarter. The median price per square foot was up both year over year (2%) and quarter over quarter (4%). And adding to the more positive picture, closings were also up 2% year over year.
But once the pandemic hit, it really, REALLY hit.
Prior to the shutdown, signed contracts were on the rise, but starting in mid-March, the rate dropped off dramatically, resulting in signed contracts being down 8% for the entire quarter versus Q1 2019 and down 13% versus Q4 2019. Listing inventory also made a dramatic about face – it slid to 7% lower than Q1 2019, and ended up at one of the lowest levels seen since Q1 2018.
Brooklyn saw a similar story play out.
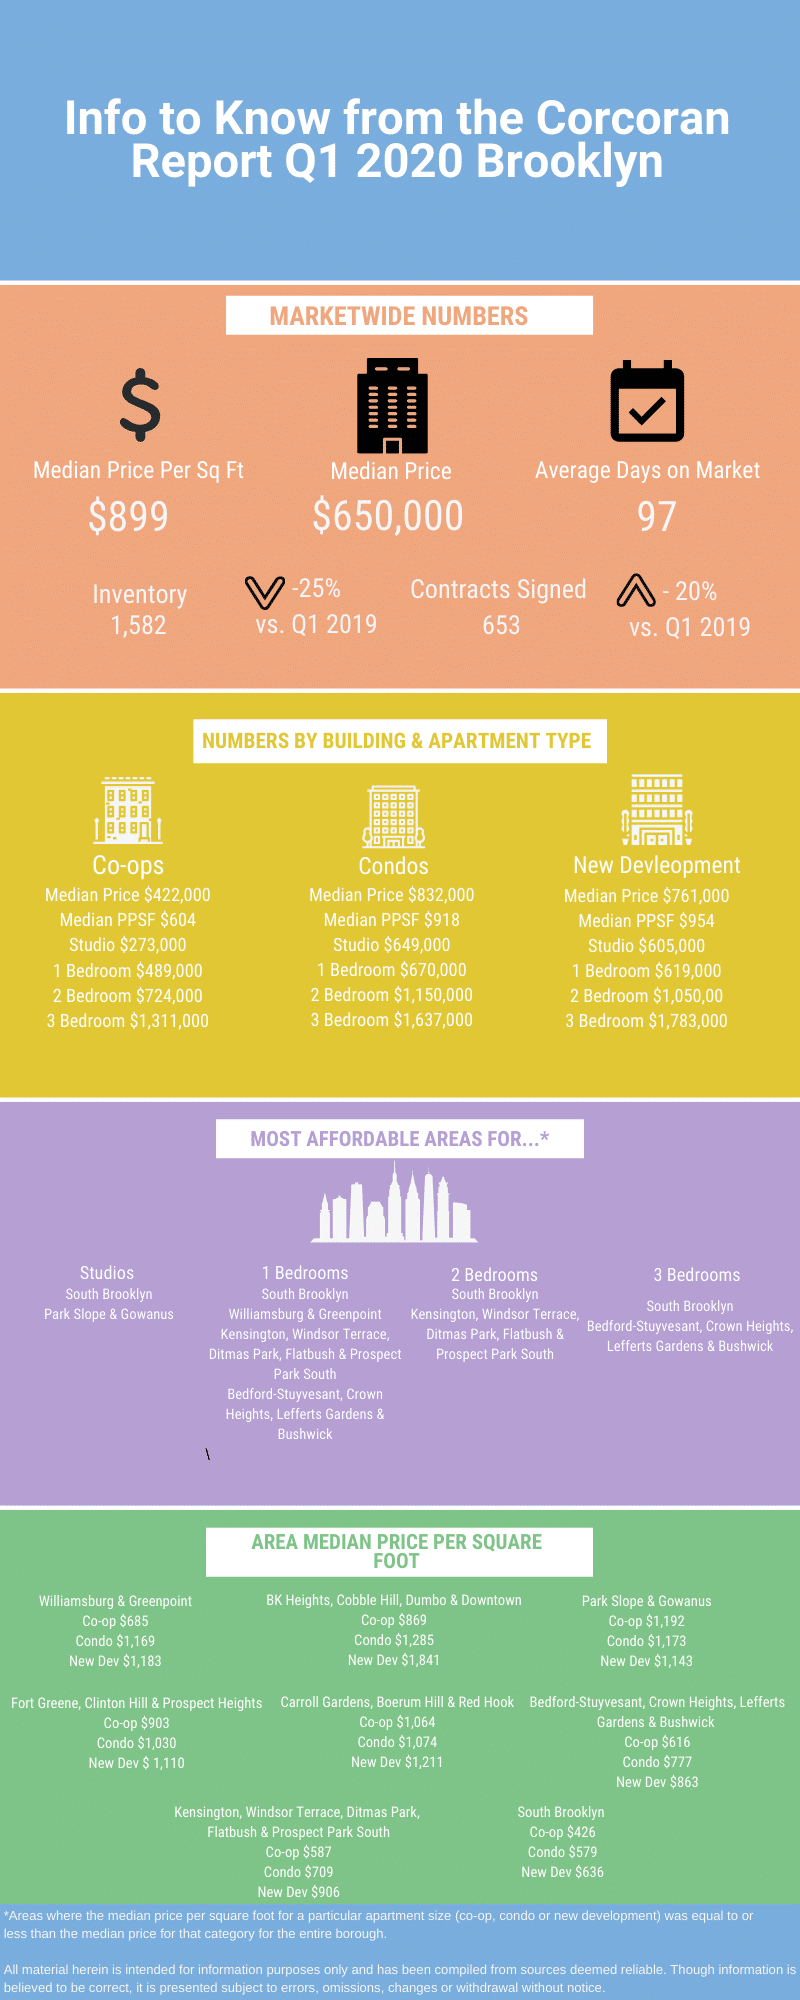
The overall median price in the borough was up to $650,000, a year over year increase of 3% but a decrease of 6% versus the previous quarter. Closed sales saw a nice bump with closings up 9% year over year and 10% versus the previous quarter.
Prior to the shutdown, the market was looking VERY strong for Brooklyn, with contract signings up 30% year over year in January. But the shutdown had a staggering effect – this tremendous gain was entirely erased and the quarter ended up seeing contract signings fall 20% year over year. And like Manhattan, inventory also contracted significantly – down a striking 25% both year over year and quarter over quarter.
It’s important to keep in mind that while the numbers listed above were impacted by COVID-19, they’re still mostly reflective of what was happening in the market before the pandemic. The closings that happened (and continue to happen) entered contract prior to the crisis, so these numbers don’t fully reflect the reality of what’s happening now.
If you’d like to know what I think may lie ahead for us in the weeks and months to come for New York City real estate, then I encourage you to check out my recent post, New York City Real Estate Market Predictions for 2020 – Everything Has Changed.
Get my NYC First Time Home Buyer Guide FREE when you sign up for my monthly newsletter
By clicking Sign Up you're confirming that you agree with our Terms and Conditions.