It’s time for the NYC monthly sales market update! Here’s a look at some key numbers for November 2022 in Manhattan and Brooklyn.
To view the full NYC sales market monthly update for November 2022, click here. And to view stats for the previous month, click here.
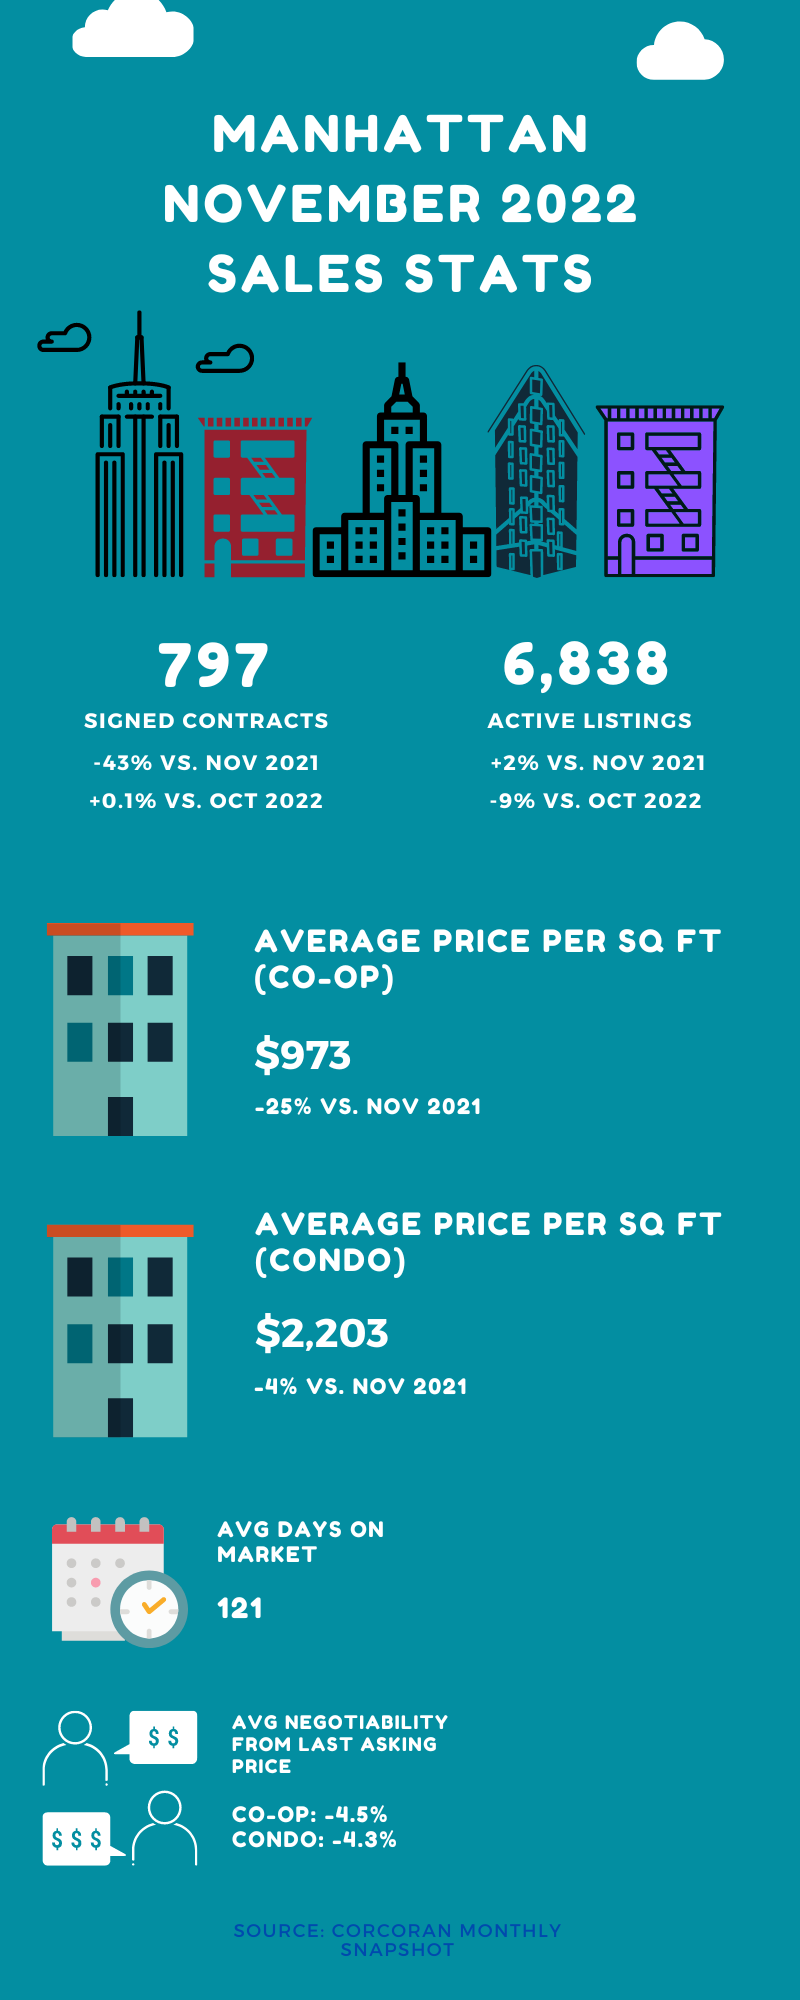

Contracts signed continued their year over year decline in Manhattan (down by 43%), but remained at roughly the same level month over month.
Other metrics were a bit more mixed for the month of November. The average price per square foot was actually up compared to October, but this was largely due to increased activity in the luxury segment of the market.
Days on market were slightly higher than November 2021, but actually ticked downwards compared to the previous month. And while inventory was up on an annual basis, it actually declined compared to October, by 9%.
But buyers were still able to get more favorable deals, since the negotiability factor held steady at 4.4% below asking.
Brooklyn also saw an annual decline in contracts signed (41%), but there was a slight increase month over month.
And we’re again seeing more evidence that the Brooklyn market may be holding firmer against headwinds compared to Manhattan.
Days on market were actually down on an annual basis. Inventory was down both year over year and month over month. And the overall price per square foot held steady, declining just 1% compared to October 2022 and November 2021.
This strength was once again reflected in the negotiability factor, with it ticking up slightly to 0.2% above asking.
Steeper price declines haven’t quite taken shape – at least not marketwide. But don’t be fooled by these numbers as they don’t tell the whole story.
Interest rates are expected to increase, albeit quite moderately compared to past increases. And the lack of significant price declines may keep more buyers on the sidelines.
Increasingly there’s more market segmentation, and Brooklyn and Manhattan seem to be diverging more and more. That’s why it’s important for buyers and sellers to assess market conditions according to property type and neighborhood.
But there’s still opportunity out there to get great value. This is especially the case for Manhattan co-ops. They saw a 25% annual decline in the average price per square foot. Furthermore, the negotiability factor for co-ops stood at 4.5% below ask – the highest spread in nearly 2 years.
If you’re on the hunt for a new place to call home, then make sure you’re prepared! Get pre-approved! Understand your finances! And get my FREE First Time Buyer’s Guide!
Get my NYC First Time Home Buyer Guide FREE when you sign up for my monthly newsletter
By clicking Sign Up you're confirming that you agree with our Terms and Conditions.